Function profiling
When coding/scripting there are two important things to do depending on the use the code is going to have: debugging and profiling.
In OpenAF there is an included mini test library that it’s actually also used to perform the OpenAF’s own build automated tests: ow.test.
In this article we are going to show how to use the ow.test to perform quick code profiling.
Example
Let’s take a simple exercise. Imagine you have a 10K entries array and you don’t know what to use: $from(array).select() or array.map().
Let’s create the array and load ow.test:
ow.loadTest();
var ar = [];
for(let i = 0; i < 10000; i++) {
    ar.push(i);
}
Let’s create now the sample function for $from:
function fromTest() {
    $from(ar)
    .select((r) => {
        return r + 1;
    });
}
And map:
function mapTest() {
    ar
    .map((r) => {
        return r + 1;
    });
}
We have the array and we have the test functions now let’s use ow.test to understand how each function behaves during 400 executions:
for(let i = 0; i < 400; i++) {
    ow.test.test("$from", fromTest);
    ow.test.test("map", mapTest);
}
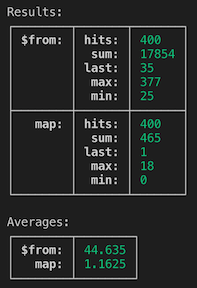
Now for the results:
print("Results:\n" + printMap(ow.test.getProfile()));
print("Averages:\n" + printMap(ow.test.getAllProfileAvg()));

So, clearly, in this case, map won to the $from. The average execution time is better and even the minimum time for $from is worse than the max for map.
Of course each case is different and that’s the reason that there never is a “silver bullet” solution. You just have to test it.